Server Performance Monitoring: 10 Key Metrics You Should Track
Servers are the "application brain," as every organization in today’s world needs a server to run their website and applications effectively. They are designed to operate 24 hours a day without downtime. However, having an under-performing server can significantly impact your website performance and affect your organization in numerous ways. Consequently, server performance monitoring is vital to ensure optimal functionality.
While basic monitoring helps, advanced environments require deeper visibility. Monitoring these 10 key metrics will help you easily understand how your server is performing, identify complex bottlenecks, and determine which server optimization strategies you need to adopt.
Key Server Performance Monitoring Indicators
Server performance monitoring helps in troubleshooting issues and fixing them at the earliest stage so that they don't affect overall performance. The server status should be evaluated using the right performance indicators to identify bottlenecks that cause slowdowns. Here are the 10 most important metrics you should track.
1. Uptime
Uptime is one of the most critical server performance monitoring indicators since it reflects the server’s availability and reliability. It is calculated as the amount of time the server is on and operating. If a server shows a 99.99% uptime value, it means the server has been available for users 99.99% of the time.
2. Peak Response Time
The Peak Response Time (PRT) helps identify the longest responses for all requests coming through a particular server. It helps figure out anomalies that make the response time longer and assists in finding pages that are facing loading issues or hang-ups during traffic spikes.
3. Average Response Time
The Average Response Time (ART) is defined as the average time taken by the server to respond to all requests. It includes the time elapsed between the end user’s initial request and the server’s last byte of the response. The lower the number, the better the server performance.
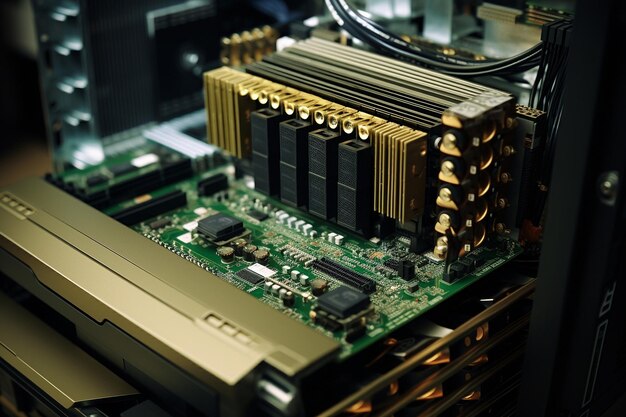
4. System-level Performance Metrics (CPU/RAM)
Poor performance often occurs when the system deals with increased levels of CPU utilization or insufficient RAM. If the server uses 100% of memory while processing requests, there might be some underlying factor that needs close attention.
5. Error Rate
The error rate shows the measure of failed requests (4xx, 5xx errors) relative to all requests. It is important to minimize the error rate since it acts as a clear indicator of performance failure. Generally, having an error rate of less than 1% is considered normal.
6. OS Log Files Monitoring
The process of evaluating event logs is termed log file monitoring. It can help you troubleshoot problems, vulnerabilities, and prevent various forms of malicious attacks. Periodic monitoring ensures you catch security issues before they escalate.
7. Network Traffic Monitoring
High bandwidth usage can have a negative impact on performance. Malware attacks or hacking attempts are often the main reason behind sudden spikes in network traffic. Regular monitoring allows you to identify anomalies and resolve bandwidth bottlenecks.
Advanced Performance Metrics
To truly optimize high-performance environments, you must look beyond the basics. These three advanced metrics are crucial for enterprise-grade stability.
8. Disk I/O & IOPS (Input/Output Operations Per Second)
Disk space is not the only storage metric that matters; speed is often the bottleneck. IOPS measures how many read/write operations your storage disk can handle per second. If your disk I/O wait times are high, your fast CPU is sitting idle waiting for data to be written to the disk, causing significant lag. Monitoring IOPS is essential for database servers and data-heavy applications.
9. Thread Count
Applications usually manage tasks by spawning "threads." If a server process (like a web server or database) exhausts its maximum thread pool, it will stop accepting new connections even if you have plenty of spare RAM and CPU. Tracking the number of active vs. idle threads helps prevent "thread exhaustion" scenarios where the server appears to hang indefinitely.
10. Swap Usage
Swap usage is a critical memory metric that goes deeper than standard RAM monitoring. When physical RAM is full, the OS moves inactive data to the hard drive (swap space). Since disk storage is significantly slower than RAM, high swap usage leads to severe performance degradation known as "thrashing." Monitoring swap activity alerts you when you need to upgrade physical RAM immediately.
Wrapping Up
Server performance monitoring is not just limited to basic uptime checks. By tracking these 10 metrics—including advanced indicators like IOPS, Thread Count, and Swap Usage—you can ensure your infrastructure remains robust under pressure.
EPY Host, with more than 12 years of experience in the industry, provides top-quality server management and support services to businesses all over the world. Our certified engineers monitor these critical metrics to keep your server optimized 24/7. Get in touch with us to know more about our managed services.
 Recent Topics for you